QualCanvas Guide
Complete Guide to QualCanvas
Learn how to use every feature of QualCanvas — from importing your first transcript to publishing your analysis. This guide covers the complete qualitative research workflow.
Getting Started
QualCanvas is a visual workspace for qualitative research. Sign up for free with Google or email, then create your first canvas to begin coding interview data.
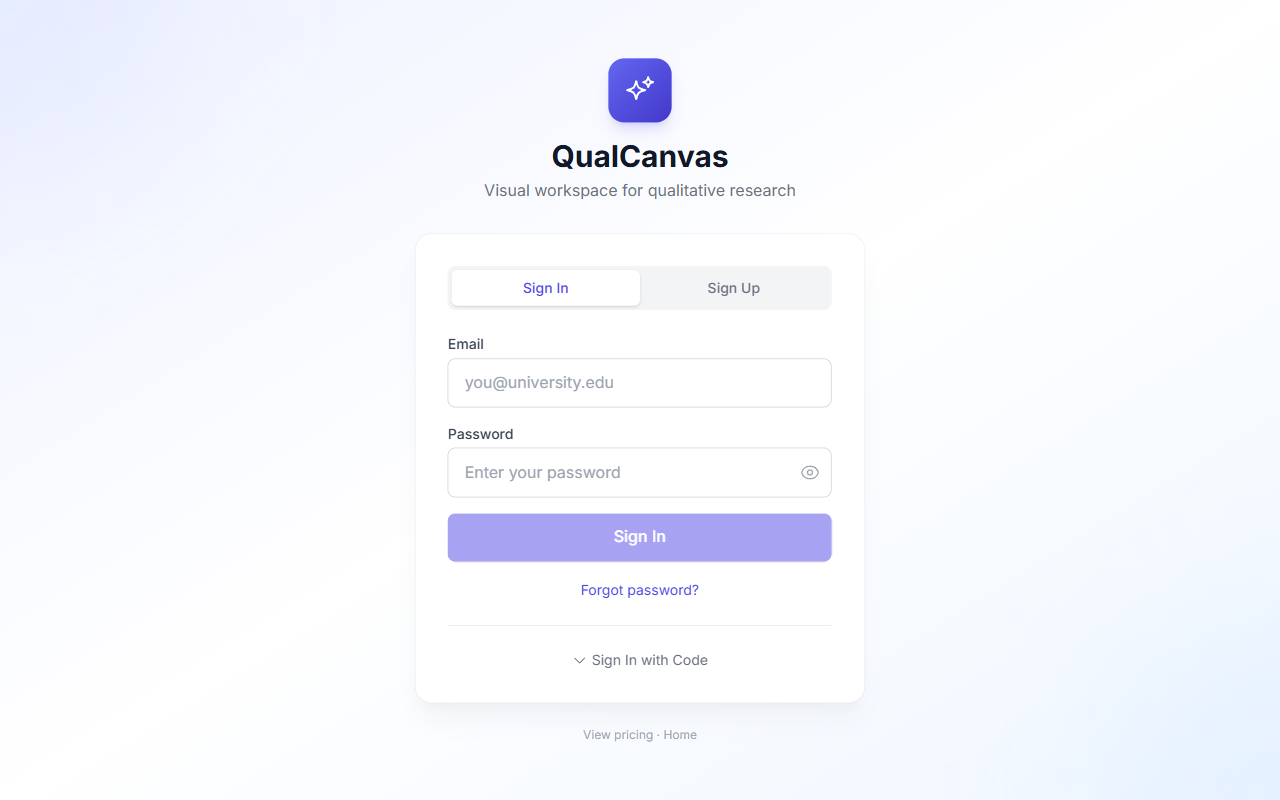
- 1Visit qualcanvas.com and click "Start Free" or "Sign In".
- 2Sign in with Google for the fastest setup, or create an email account.
- 3You'll land on the Canvas List page where you can create your first workspace.
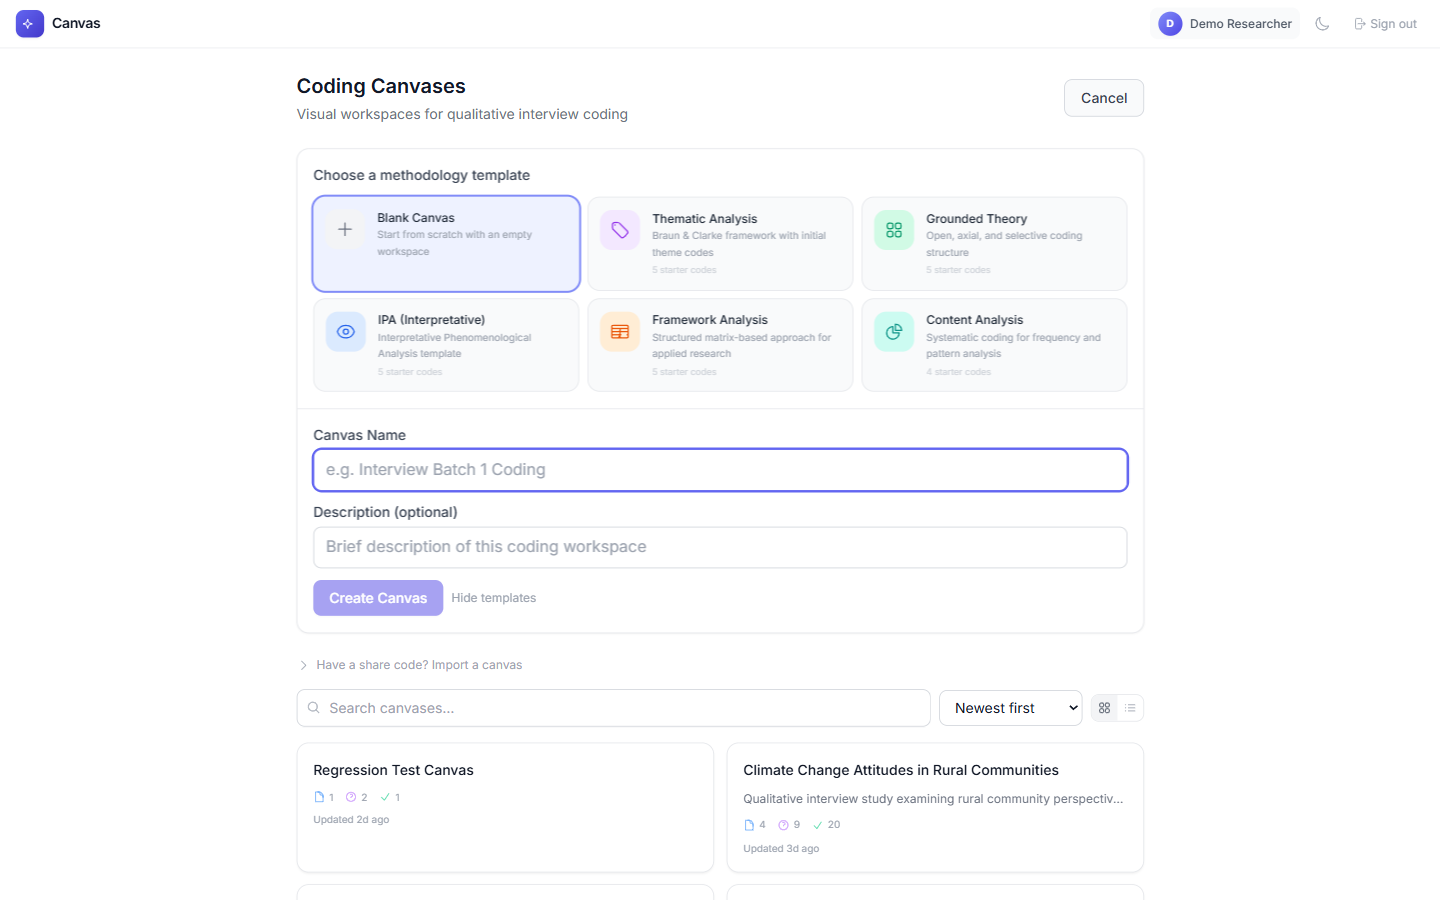
Choose from six methodology templates (Thematic Analysis, Grounded Theory, IPA, Framework Analysis, Content Analysis) or start with a blank canvas. Each template comes with pre-configured starter codes.
The Thematic Analysis template is perfect for beginners — it sets up codes based on Braun & Clarke's framework.
The Canvas Workspace
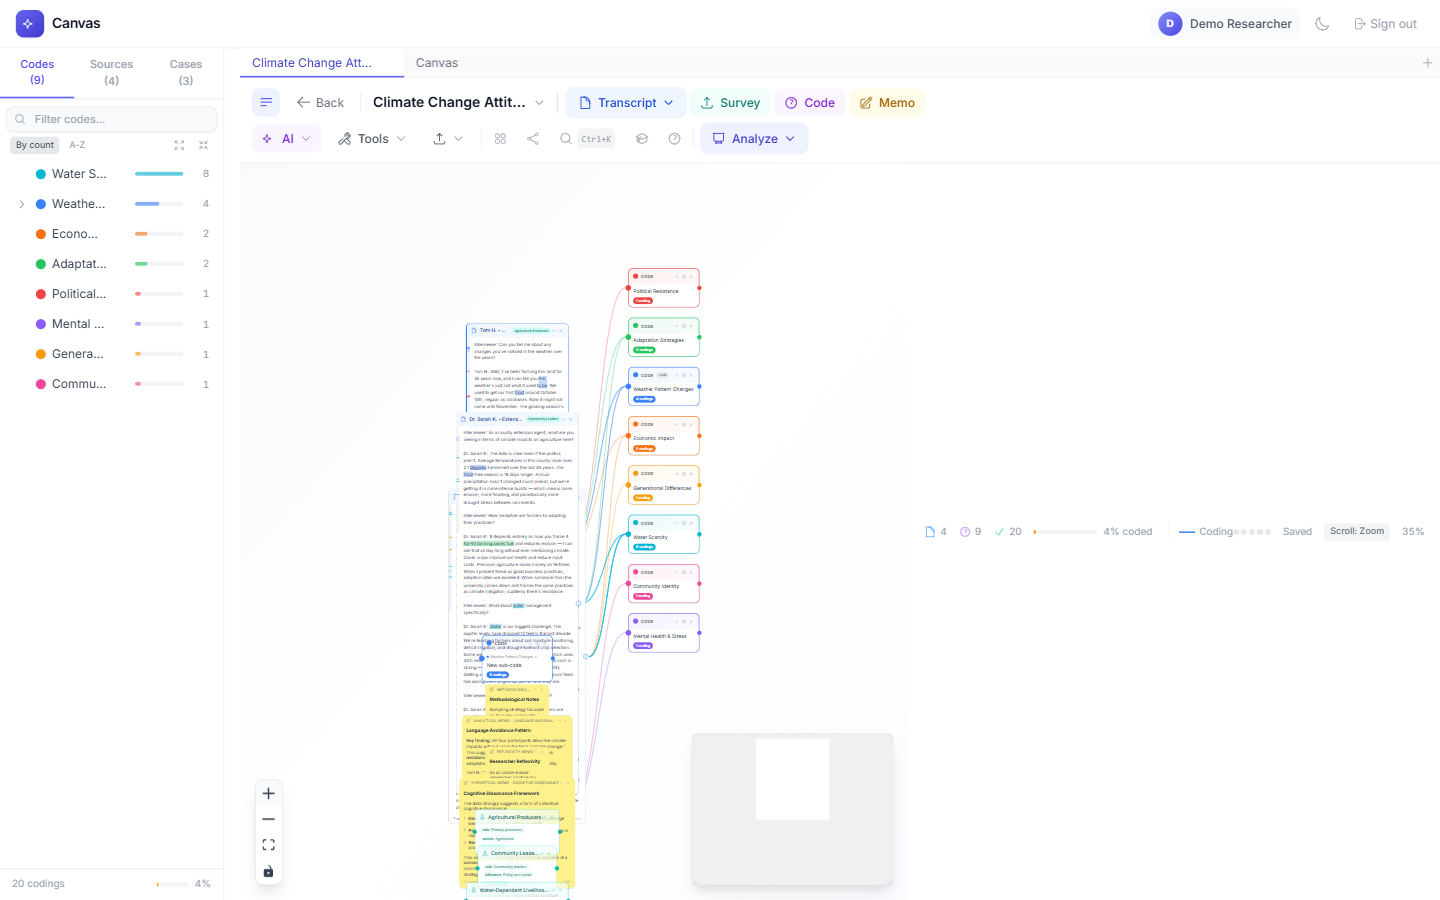
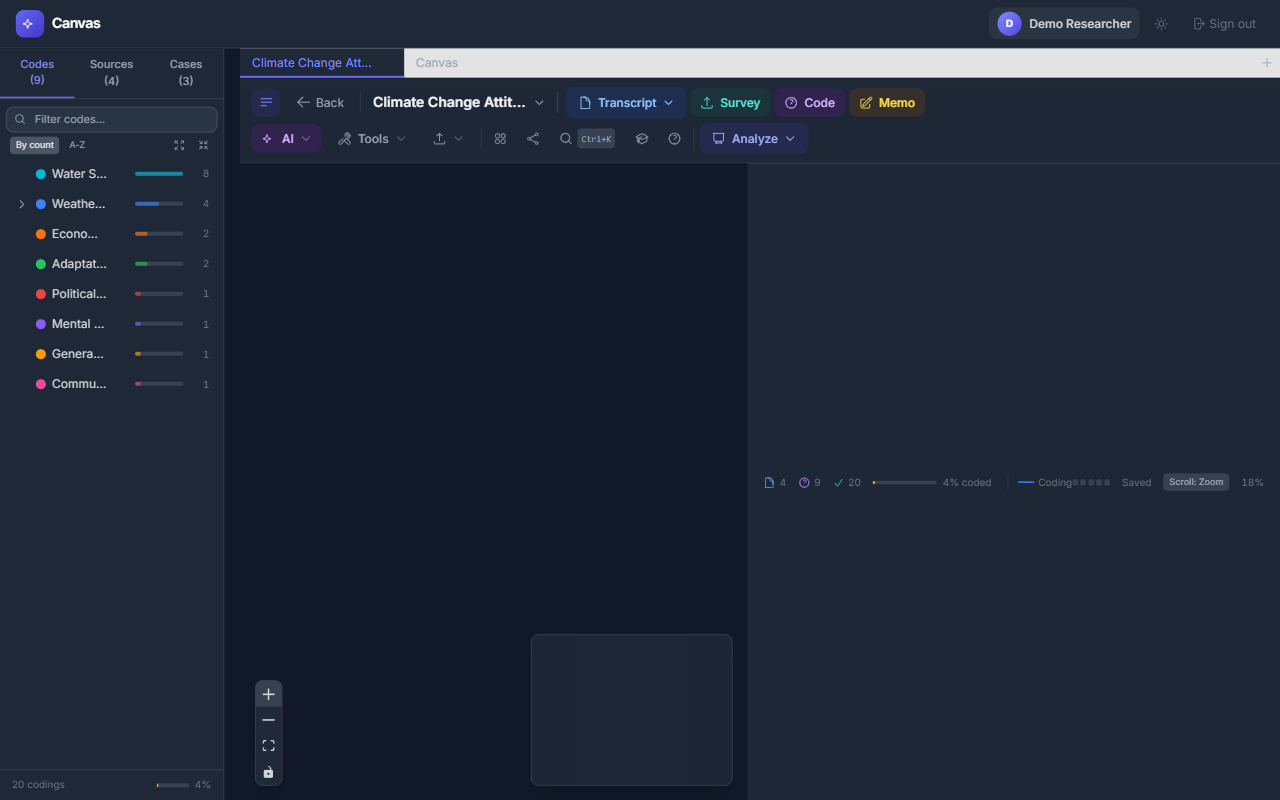
The canvas workspace is where all your research happens. It's built on an infinite, zoomable canvas where you can arrange transcripts, codes, memos, and analysis nodes visually.
Key Areas
- Toolbar (top): Primary data tools (Transcript, Survey, Code, Memo) plus dropdown menus for AI, Tools, Export, and Analysis.
- Navigator (left sidebar): Shows all your codes and sources at a glance. Click any code to see its coded passages.
- Canvas (center): The infinite workspace where you drag, connect, and arrange nodes.
- Status bar (bottom): Shows document count, coding progress, collaboration status, and zoom level.
- Controls (bottom-left): Zoom in/out, fit view, and toggle interactivity.

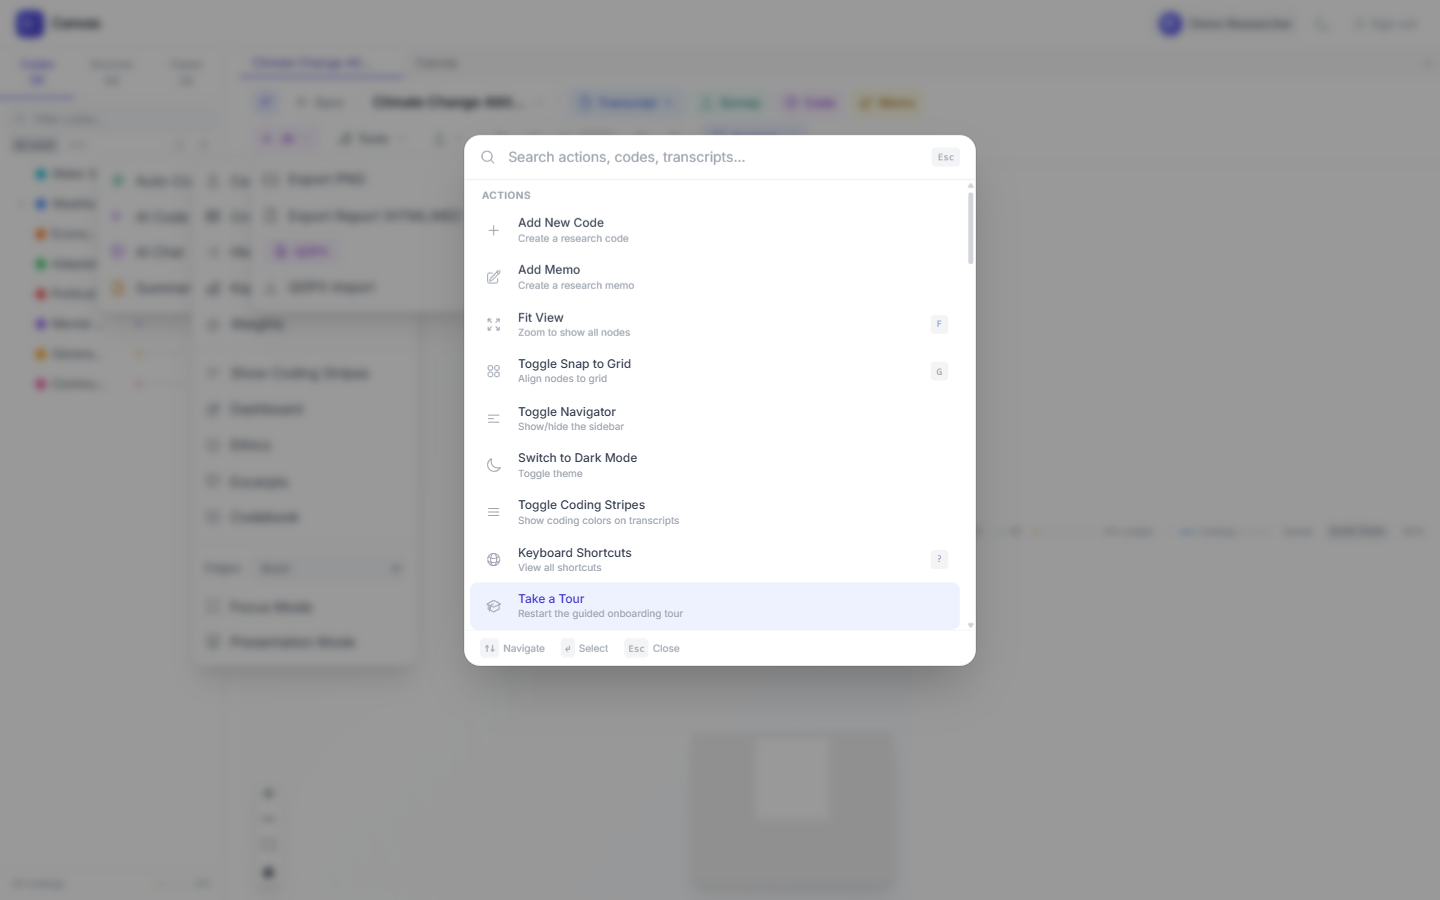
Press Ctrl+K anytime to open the Command Palette — search for any action instantly.
Adding Transcripts
Everything starts with your data. Import interview transcripts by pasting text, uploading CSV files, or dragging .txt files directly onto the canvas.
- 1Click the "Transcript" button in the toolbar (or press Ctrl+K and type "transcript").
- 2Choose "Paste Text" to enter text directly, or "Import CSV" for batch import.
- 3Give your transcript a title (e.g., the participant's pseudonym).
- 4The transcript appears as a node on the canvas that you can drag and resize.
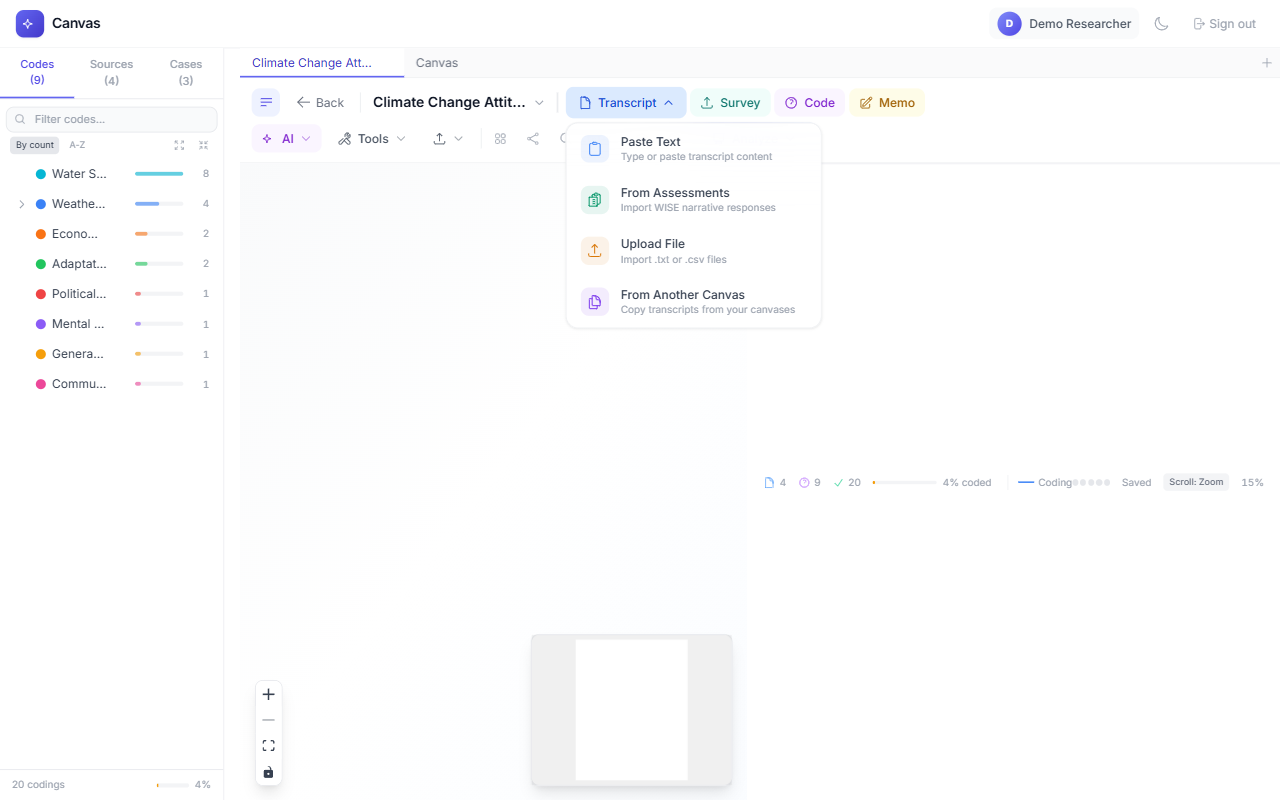
Import multiple interviews from a single CSV file — use columns for title and content.
Creating Codes
Codes are the labels you use to tag themes in your data. Think of them as colored highlighters — each code marks a concept you want to track across interviews.
- 1Click the "Code" button in the toolbar.
- 2Type your code name (e.g., "Trust Issues", "Barriers to Care").
- 3Press Enter — a new code node appears on the canvas with a unique color.
- 4Create as many codes as you need. Pro plan users get unlimited codes.
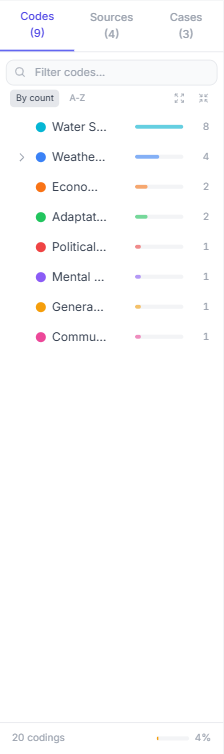
Each code gets a distinct color so you can instantly see which themes appear where. You can organize codes into hierarchies using the Hierarchy tool in the Tools menu.
Use short, descriptive code names. You can always rename them later by double-clicking the code node.
Coding Your Data
Coding is the core activity — you select text in a transcript and assign it to a code. Lines automatically connect transcripts to codes, creating a visual network of your analysis.
- 1Click on a transcript node to open it.
- 2Select (highlight) a passage of text that represents a theme.
- 3A popup appears — choose the code to assign.
- 4A colored edge connects the transcript to the code, showing the relationship.
- 5Repeat across all your transcripts to build a rich coding network.
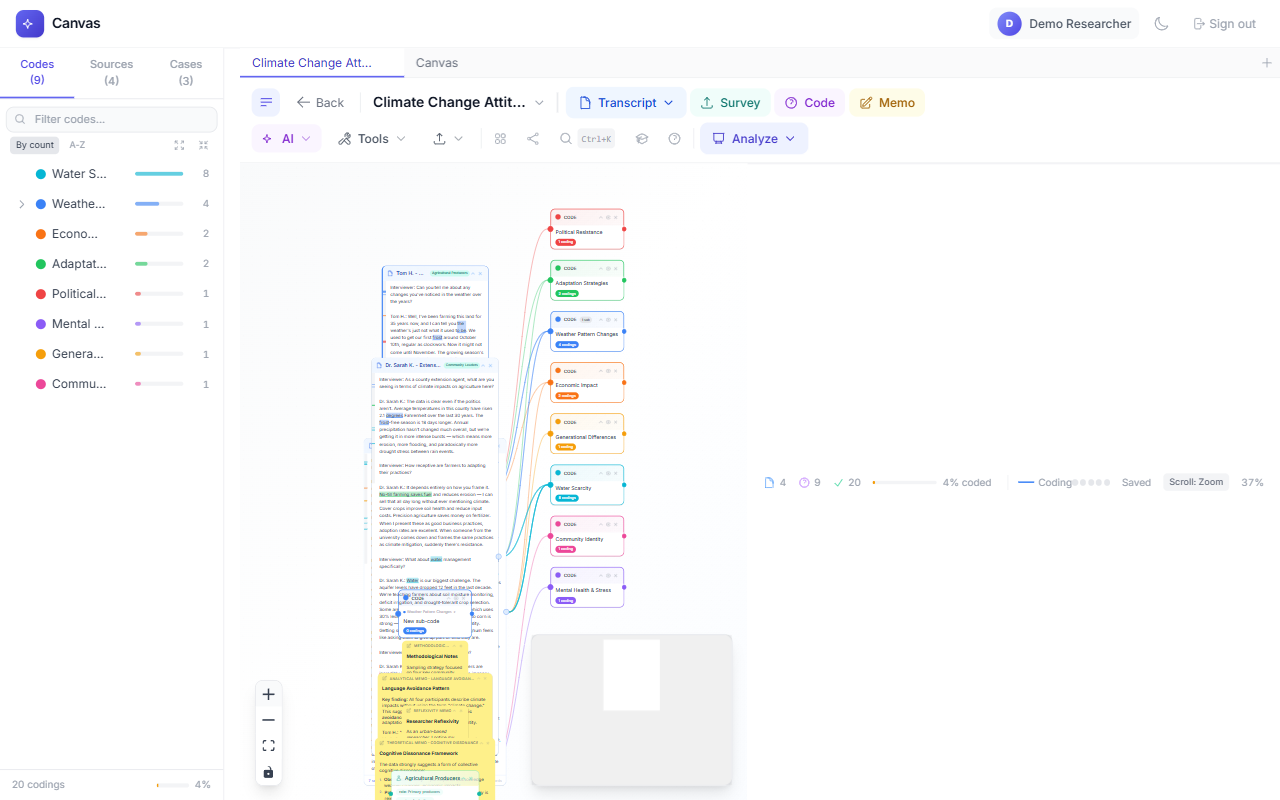
The more you code, the richer your visual network becomes. Codes with many connections indicate strong themes in your data.
Code Navigator
The Code Navigator in the left sidebar gives you a real-time overview of your codebook. It shows every code with a frequency bar indicating how often each code was used.
- 1Click "Codes" tab to see all codes sorted by frequency or alphabetically.
- 2Click any code to highlight its connections on the canvas and see all coded passages.
- 3Click "Sources" tab to see all transcripts with their coding coverage.
- 4Use the filter box to search for specific codes.
Toggle between "By count" and "A-Z" sorting to see your most-used codes vs. alphabetical order.
Analysis Tools
QualCanvas includes 12 analysis tools organized into three categories. Click the "Analyze" button in the toolbar to add analysis nodes to your canvas.
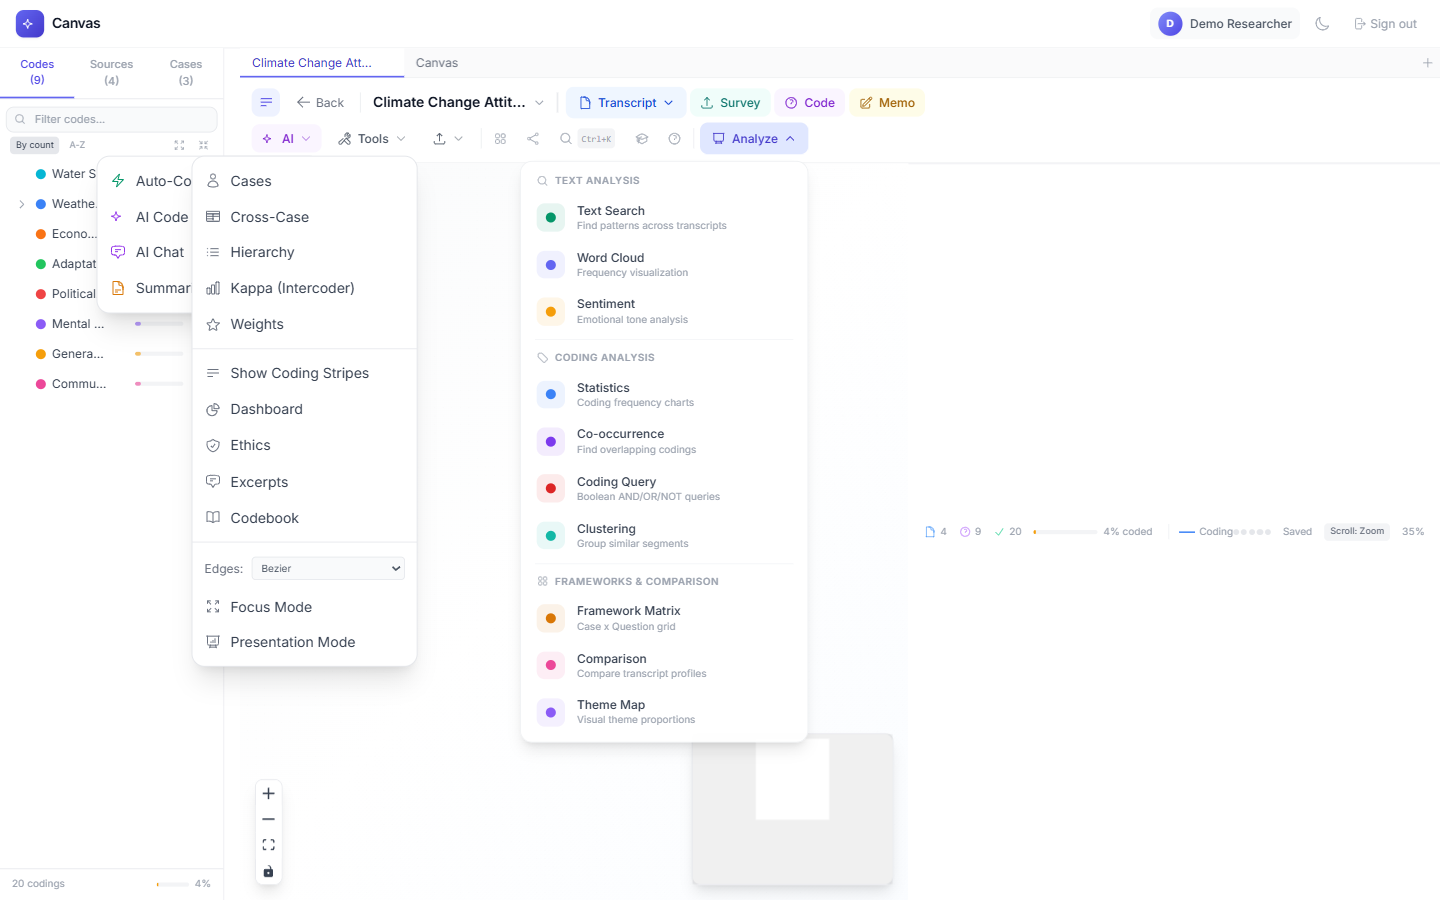
Available Analysis Types
Text Analysis
- Text Search: Find patterns across transcripts with regex support.
- Word Cloud: Visualize word frequency across coded passages.
- Sentiment: Positive/negative/neutral analysis of coded text.
Coding Analysis
- Statistics: Code frequency, distribution, and coverage metrics.
- Co-occurrence: Matrix showing which codes appear together.
- Coding Query: Boolean AND/OR/NOT queries on your codings.
- Clustering: Group similar coded segments together.
Frameworks & Comparison
- Framework Matrix: Case x Question grid for structured analysis.
- Comparison: Compare coding patterns across transcripts.
- Theme Map: Visual theme proportions across your data.
Analysis nodes update live as you add more codings. Keep a word cloud on your canvas to see patterns emerge in real time.
AI Features
QualCanvas integrates with OpenAI, Anthropic, and Google AI to supercharge your analysis. Bring your own API key — you pay your AI provider directly.
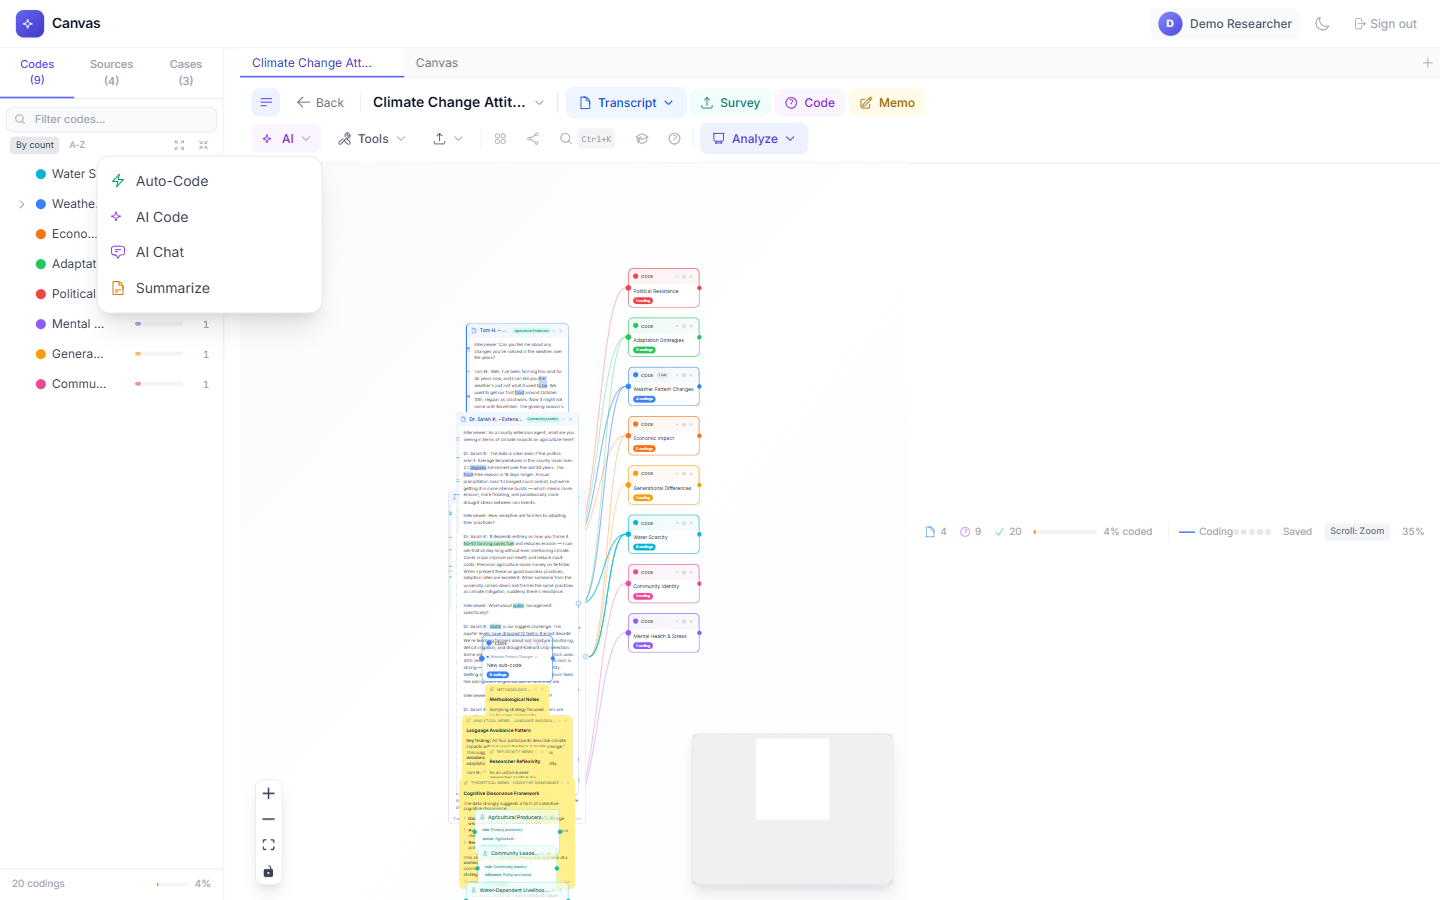
AI Tools
- Auto-Code: Scan transcripts and apply codes by keyword or regex pattern.
- AI Code: Get intelligent coding suggestions based on your existing codebook.
- AI Chat: Ask questions about your data in natural language. Get answers with citations.
- Summarize: Generate concise overviews of transcripts or coded passages.
- 1Go to Account Settings and add your API key (OpenAI, Anthropic, or Google).
- 2Click the "AI" dropdown in the toolbar.
- 3Choose the AI tool you want to use.
- 4Follow the prompts — AI suggestions are always reviewed by you before applying.
Try AI Chat with "What are the main themes across all interviews?" — it searches all your transcripts and synthesizes an answer.
Cases & Cross-Case
Group transcripts into cases (e.g., by participant, site, or time period) and compare coding patterns across cases using the framework matrix.
- 1Open Tools > Cases from the toolbar.
- 2Create a new case and assign transcripts to it.
- 3Add attributes to cases (e.g., age, location, role).
- 4Use Tools > Cross-Case to compare coding patterns across cases.
Cases are powerful for multi-site studies — compare coding patterns between different research sites or participant groups.
Ethics & Compliance
QualCanvas includes built-in ethics and compliance tools to help you manage consent, anonymize data, and maintain an audit trail for your research.
- 1Open Tools > Ethics from the toolbar.
- 2Record consent for each participant with status tracking.
- 3Set data retention dates and anonymization policies.
- 4Anonymize transcripts with automatic name/location replacement.
- 5View the full audit trail of all actions on your canvas.
Set up ethics compliance before adding data — it's easier to track consent from the start than to retroactively add it.
Import & Export
Export your work in multiple formats for publication, sharing, or interoperability with other qualitative analysis tools.
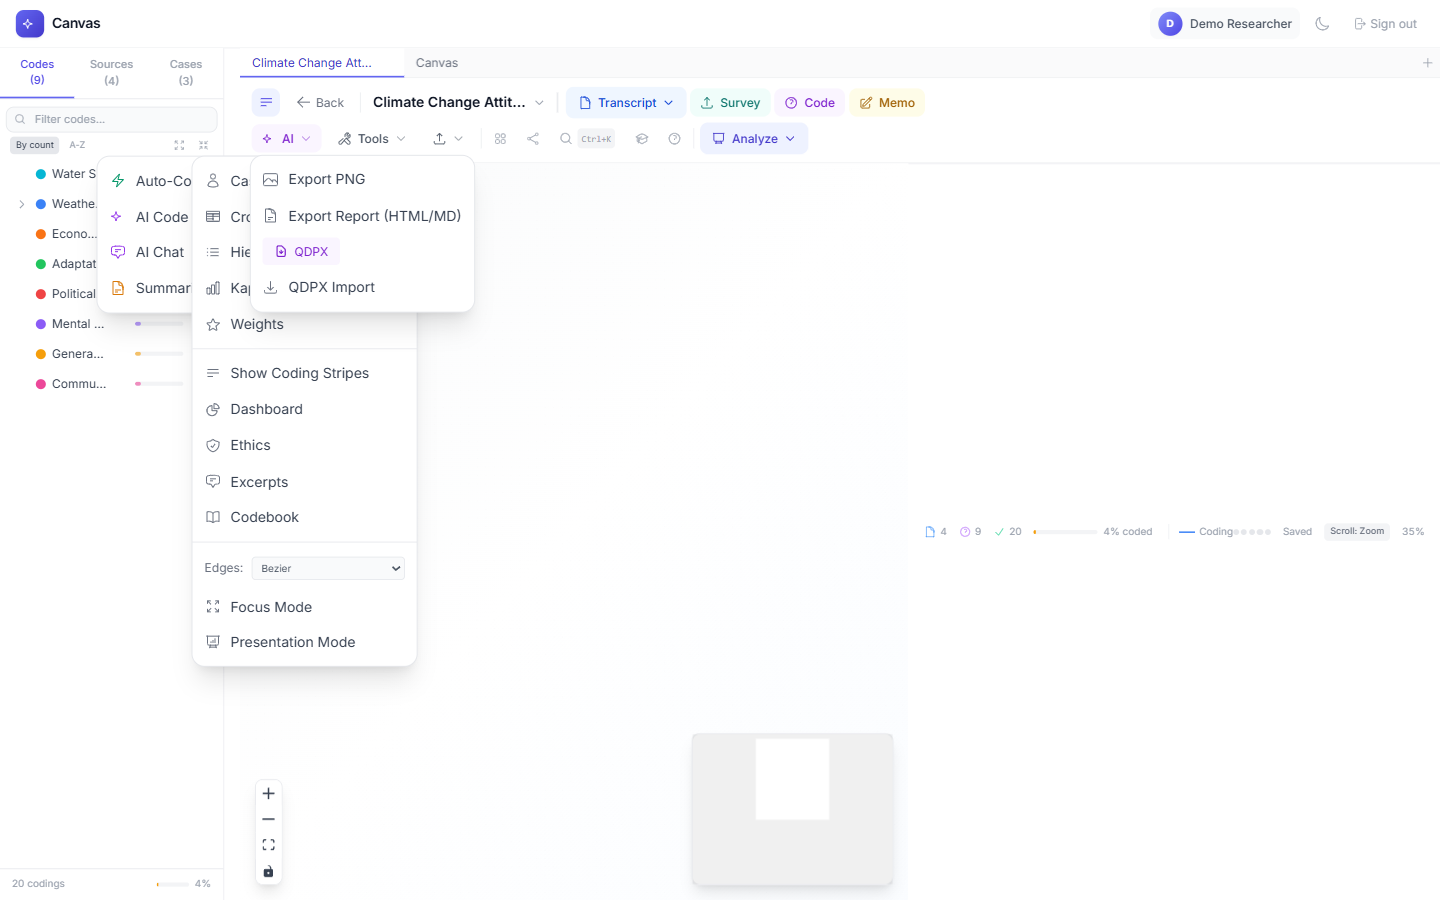
Export Formats
- PNG Image: Save your canvas as a high-resolution image.
- HTML/Markdown Report: Generate a formatted analysis report with excerpts and statistics.
- QDPX: Export for NVivo and ATLAS.ti interoperability (open standard).
- CSV: Export codebook, codings, or excerpts as spreadsheets.
- Codebook: Export your complete codebook with definitions and frequencies.
QDPX is the open standard for qualitative data exchange — use it to move projects between QualCanvas, NVivo, and ATLAS.ti.
Collaboration
Team plan users can collaborate in real time on the same canvas. See who's online, where they're working, and what they're coding — all live.
Collaboration Features
- Presence Avatars: See who's currently viewing the canvas.
- Live Cursors: Watch other researchers' cursors move in real time.
- Real-time Sync: All changes sync instantly via WebSocket.
- Intercoder Reliability: Run Cohen's Kappa with one click (Team plan).
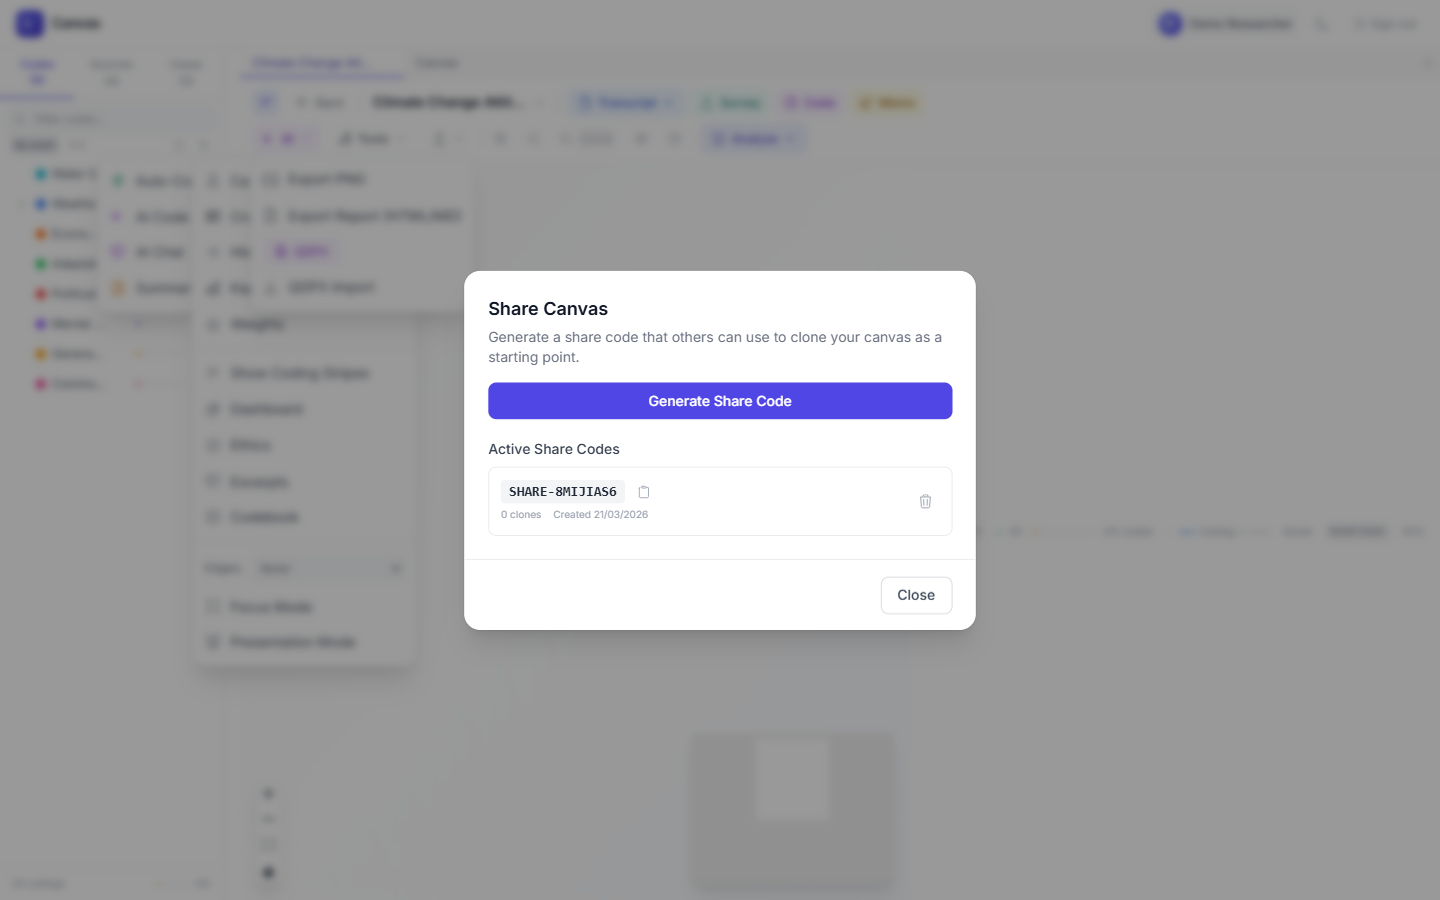
- Share Codes: Generate share codes so collaborators can access your canvas.
Run intercoder reliability (Kappa) after independent coding sessions to measure agreement between researchers.
Keyboard Shortcuts
Power users love keyboard shortcuts. QualCanvas has 20+ shortcuts that are fully customizable.
Essential Shortcuts
- Ctrl+K — Command Palette (search any action)
- Ctrl+Z — Undo
- Ctrl+Shift+Z — Redo
- F — Fit view (show all nodes)
- ? — Show all keyboard shortcuts
- Delete — Delete selected nodes
- Alt+Drag — Duplicate a node
Press ? on the canvas to see all shortcuts. Every shortcut can be remapped in the shortcuts modal.
Account & Billing
QualCanvas offers four plans: Free, Student ($5/mo), Pro ($15/mo), and Team ($39/mo per seat). Upgrade anytime from the Pricing page or Account settings.
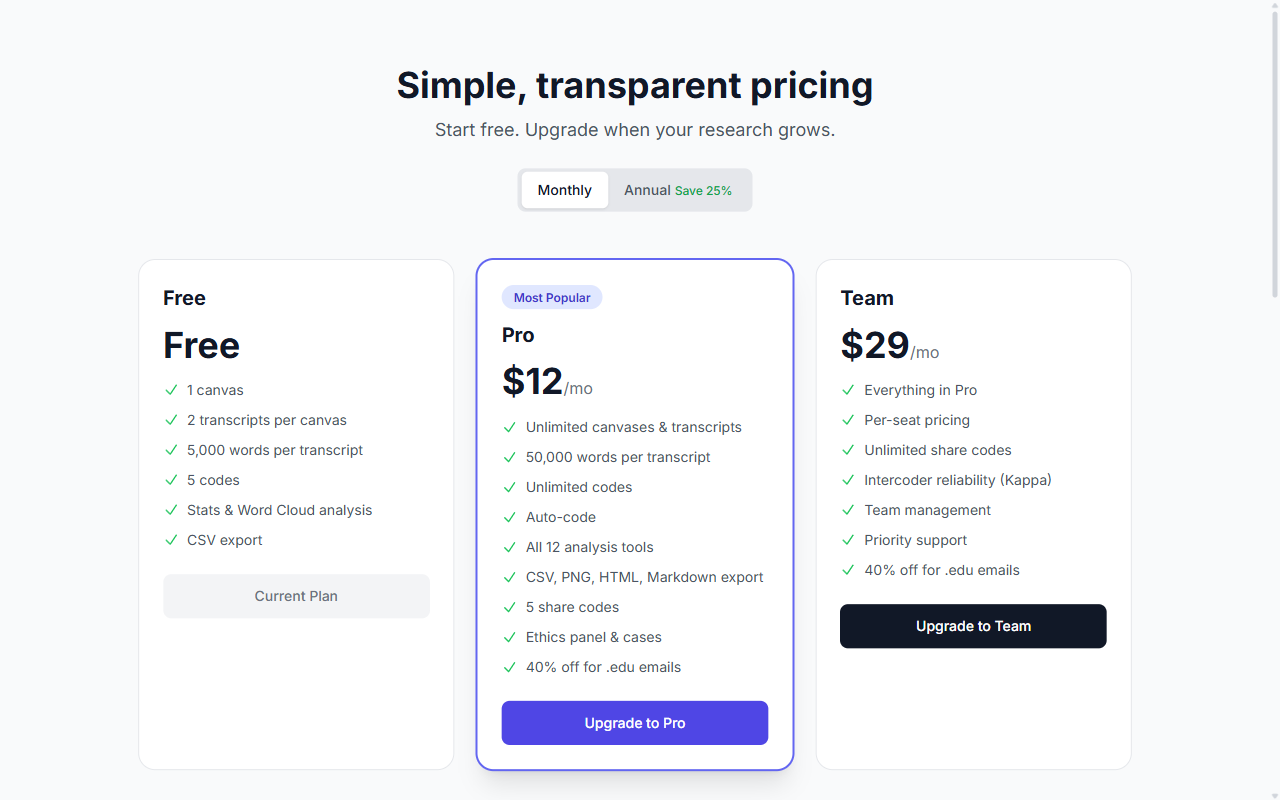
Plan Comparison
- Free: 2 canvases, 5 transcripts, 10 codes, and 4 analysis tools.
- Student ($5/mo): Verified academic email. 5 canvases, all 13 analysis tools, auto-code, ethics + cases, ~5 hrs transcription.
- Pro ($15/mo): Unlimited everything, all 13 analysis tools, AI features, ethics panel, 5 share codes.
- Team ($39/mo per seat): Everything Pro + unlimited shares, intercoder reliability, team management.
Students get the dedicated Student plan at $5/mo with a verified academic email; faculty and staff get 40% off Pro and Team automatically at checkout. Annual billing saves ~20%.
Mobile & Accessibility
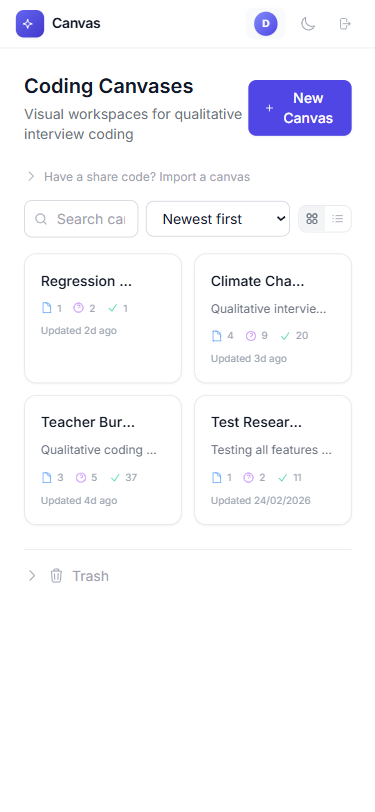
QualCanvas works on any device — desktop, tablet, or phone. The interface adapts to your screen size, and dark mode is supported throughout.
Accessibility Features
- Dark Mode: Toggle via the moon icon in the header. Follows system preference on first visit.
- Responsive Layout: Toolbar collapses into dropdown menus on small screens.
- Touch Gestures: Pinch to zoom, swipe to pan on touch devices.
- Keyboard Navigation: Full keyboard accessibility with skip links and focus management.
- Offline Mode: Canvas data is cached locally for offline access.
Install QualCanvas as a PWA (Progressive Web App) for a native app experience — look for the install prompt in your browser.
Ready to start coding?
Create your free account and begin analyzing qualitative data in minutes.
Create Free Account